
Love them or hate them, Impact Factors are one of the main ways in which many schools and departments measure scientific output and impact. Those of us working in non-CS departments have to regularly expain the selectiveness and import of CS conference proceedings to our journal-based colleagues. Here is another tool for that discussion with the dean: Journal Impact Factors for CS Conferences!
Results
The figure below plots the number of 2022 citations per article published in each venue in 2020 and 2021. The blue dot indicates the distribution mean (the so-called Impact Factor). We can see a broad range of impact factors for A* conferences. Among our selection, the International Conference on Learning Representations (ICLR) leads the pack with an Impact Factor of 48.87, corresponding roughly to that of journals such as Nature and Science.
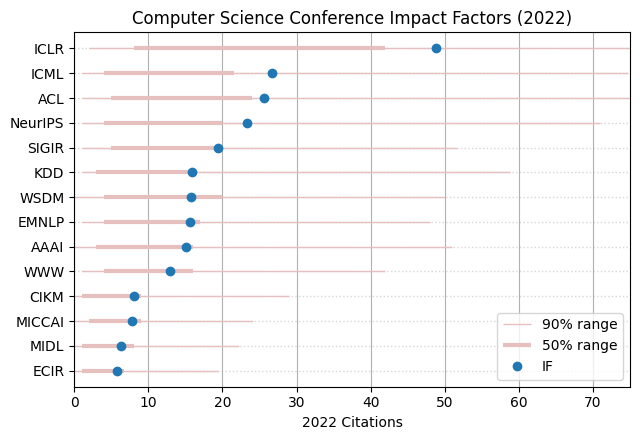
The raw data underlying these distributions show some interesting patterns. Unsurprisingly, for all venues, the median number of early citations that 2020 and 2021 pubications incurred is significantly lower (on average by a factor of 2) than the distribution mean (the impact factor). This proclivity towards highly cited outlier publications was particularly strongly expressed at ICML (2.67) and NeurIPS (2.59), and least pronounced for WSDM (1.76) and WWW (1.73).
| Conference | mean # of Citations (IF) | median # of Citations | # of Papers |
|---|---|---|---|
| ICLR | 48.87 | 20 | 1596 |
| ICML | 26.66 | 10 | 2267 |
| ACL | 25.66 | 12 | 1351 |
| NeurIPS | 23.27 | 9 | 4236 |
| SIGIR | 19.41 | 9 | 298 |
| KDD | 15.95 | 8 | 456 |
| WSDM | 15.82 | 9 | 161 |
| EMNLP | 15.68 | 8 | 1599 |
| AAAI | 15.02 | 7 | 3274 |
| WWW | 12.99 | 7.5 | 574 |
| CIKM | 8.11 | 4 | 464 |
| MICCAI | 7.82 | 4 | 1078 |
| MIDL | 6.36 | 3 | 165 |
| ECIR | 5.78 | 3 | 114 |
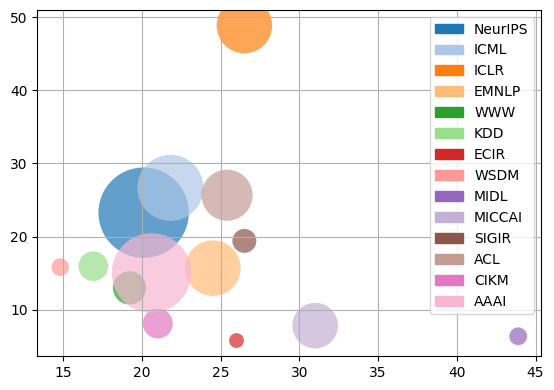
Finally, let us have a look at the relationship between acceptance rates and impact factors. This experiment is of course not entirely serious as Impact Factors do not capture where your work will fit best and receive most atention, but if you are hunting IFs more than anything, this is where you get them on the cheap.
Methodology
We computed 2022 two-year impact factors by collecting all full papers published in the main track of a given venue in 2020 and 2021 and reporting the average number of times these articles were cited in 2022. The citable items were taken from the official proceedings of the respective conferences. Citation counts were determined via Google Scholar.
Acceptance rates for 2020 and 2021 were obtained from the official conference websites and were averaged to obtain a global estimate of venue selectiveness.
Limitations
While we followed the official methodology used by Clarivate, Thomson-Reuters and Co, you should be aware of some potential differences. Most notably, where traditional publishing houses will only consider "indexed journals" our counts based on Google Scholar are more inclusive and will tally MS theses, preprints, etc. when counting citation numbers.
Next Steps
We intend to keep this bibliometric project alive in the near future. The conference selection is currently biased towards our lab's NLP, IR and ML focus. Feel free to suggest other venues on Twitter or Mastodon that you would like us to include in the future.